Part 1
What if the loudest concerns about Canadian agriculture are only half the story?
Agriculture punches above its weight in Canada. It feeds the country, anchors rural economies, and competes on a global stage — yet the industry is increasingly being described as one that is falling behind. Reports from major institutions have sounded the alarm on declining productivity, a shrinking talent base, low innovation, and those concerns aren’t wrong. But context matters. This post is the first in a series that examines the data behind the headlines, the implications on frontline producers, and the picture that emerges is more nuanced than the narrative suggests.
The Prevalent Perspective on Canadian Agriculture
Recent reports (RBC, FCC, UCalgary) suggest that the Canadian agricultural industry is decelerating, with a reduction in the sector’s productivity growth relative to recent decades. These same reports argue that low employment within the sector, coupled with reductions in research and development (R&D), are contributing to Canadian agriculture falling behind its global competitors. Farm Credit Canada, in particular, forecasts that if these trends do not reverse, we could see total factor productivity (TFP) growth fall even further, potentially matching the growth rates seen throughout the 1970s. We should take care in our emphasis on TFP growth rates, as the 1980s are shown to have seen an increase in TFP growth compared to the 1970s, though the metric does not represent the outlook and realities of farming through the period. Throughout the 1980s, farmers in western Canada experienced steep decreases in commodity prices, coupled with rising interest rates relative to the past decade, peaking in 1981 at 19.29%, placing large financial pressures on farms, especially those who took on debt to expand. Even with the dim current outlook, it is recognized that the apparent issues presented do allow for opportunity within the sector to advance its adoption of new technologies, paving the way for the sector’s continued contribution to Canada’s economy, alongside improving the bottom line for producers.
How does Canadian Agriculture Weigh Up?
First, we need to define TFP, and its implications for the sector. Total factor productivity is defined as “ a way of measuring the effect that technology and the knowledge, skills, and energy of workers have on the amount produced by a business or economic system.”
A simplistic formula of TFP follows, 
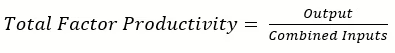
As a ratio TFP can be increased by either increasing outputs relative to input or reducing inputs relative to output. The inverse holds true for reductions in TFP. In this context, the general outputs utilized for agricultural TFP include the value of commodities grown and sold, encompassing both crops and animal production. Inputs contain land, labor, capital, and materials. Land is relatively straightforward, capturing farmland, water rights and irrigation sources, and soil quality, among other factors. The capital component of inputs relates to machinery such as tractors or harvesters, storage facilities, and other infrastructure. The materials category includes items such as feed, seed, fuel, and fertilizer. As an example that shifts TFP, if a farmer can reduce their fertilizer costs while holding yields steady (achievable through 4R practices) we would expect TFP to increase.
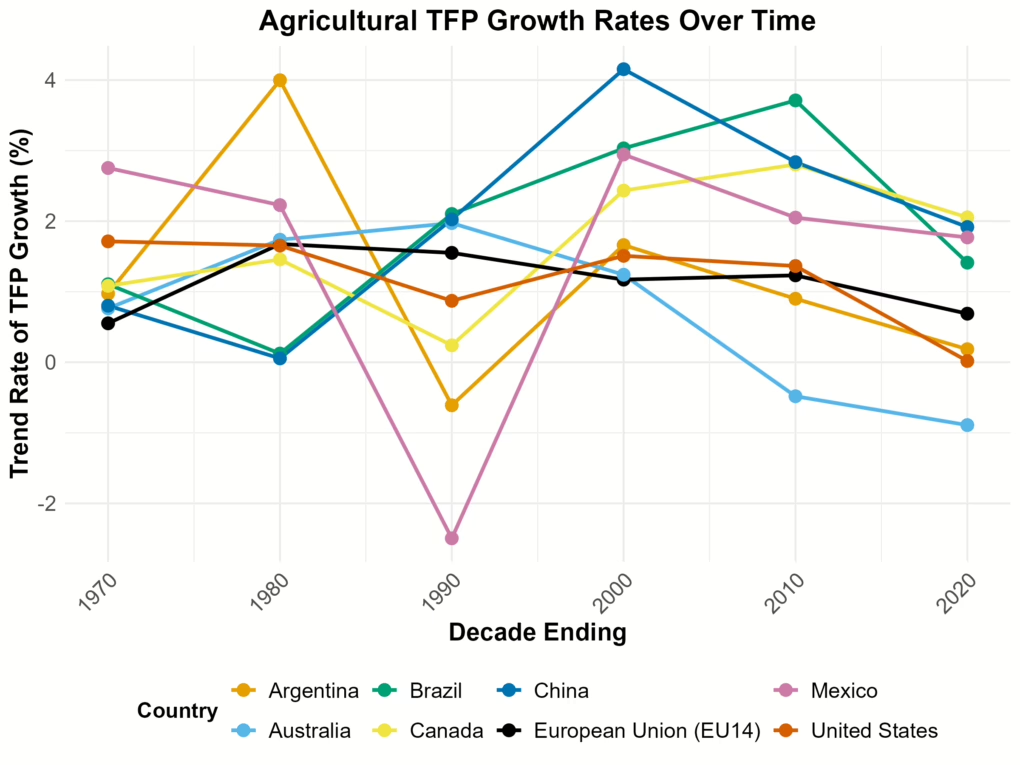
Now generally in economic discussions, we look to growth in TFP expressed as a percentage term, utilizing an indexed series. TFP growth rates can follow a simple average, a compounded annual growth rate (CAGR) approach, or the trend rate of growth, the approach we employ here, which stems from a log-linear regression equation. Over time, we generally anticipate TFP to increase as new technologies, practices, and capabilities are discovered and implemented in industry, creating more efficient production.
The dominant source of agricultural TFP indices come from the United States Department of Agriculture (USDA), providing a long term, standardized data set. presents the TFP growth rates by decade for selected countries following the aforementioned method of estimating the growth rate, which is suggested by the USDA.

As we can see in the above graph, Canada’s agricultural TFP growth, while indeed decreasing, still compares favorably against other major agricultural competitors. The apparent declines across all countries suggest that Canada is not the only nation facing difficulty in maintaining consistent efficiency gains in agriculture.
It should be noted that it is common practice for researchers and analysts to make stylistic adjustments when calculating TFP growth rates. For example, some may omit certain input or output categories, substitute private data sources to improve accuracy, or adjust the time period under analysis. These choices all influence the resulting growth rate, and as such, estimates may vary across sources. In this application, we make no adjustments to the indices from the USDA; however, it is worth noting that our figures may differ from other sources, though general trends over time remain comparable.
Now, what about within Canada? How does agriculture compare to other prominent industries? To answer this, we will look to the Canadian multi-factor productivity (MFP) data. MFP and TFP are closely related and generally are interchangeable, with slight differences in calculation given that this is a different index than the USDA agriculture TFP. The values are not directly comparable, but once we calculate the growth rates, we can still observe the trends presented by the index. A good read on overall productivity growth in Canada is found here.
This graph shows the reported MFP trend growth rate of agriculture, compared to some of Canada’s prominent industries. Comparatively, agriculture holds a small share of the total business sector’s output, but it is still informative to inspect growth rates across sectors.

As shown above, agriculture’s MFP growth has been declining in the most recent decade relative to other sectors, though it remains relatively high. Now we will look at a similar figure but instead have selected the industries which have had the highest average growth over the past 20 years. As we can see, agriculture’s MFP growth rate is among the highest of any sector for the period we define.

Regarding productivity growth in Canada, agriculture has been slipping as of recent years, and it is important to strive to break this trend and increase the efficiency of the sector. Doing so requires continued efforts from frontline producers, tertiary industry, and innovation in agricultural technology, coupled with broader technology adoption to boost sector-wide outcomes. That said, the data reviewed here suggest that both internationally and within Canada, the agricultural sector remains a relative leader — with considerable runway ahead.
Talent, Education, and Employment
The report from RBC Thought Leadership argues that the Canadian agricultural sector faces challenges attracting talent, pointing to elevated job vacancy rates and limited engagement from science, technology, engineering, mathematics (STEM), and business graduates.
First, we will look at the data series from Statistics Canada reporting on job vacancy rates and payroll employees by industry sector in Canada. Based on the most recent 2025 data, the average vacancy rate in all industries reported in the series is 2.86%, with agriculture coming in 6th highest at 3.16%. Industries such as Construction, Health Care, and Accommodation and Food Services have higher vacancy rates. In terms of total job vacancies by count, agriculture ranks 15th highest sector out of the 20 sectors tracked. Those with lower vacancy counts include Real Estate, Information and Culture, Mining and Oil & Gas, Management, and Utilities. In terms of average payroll employment for 2025, agriculture ranks 17th, showing that most sectors have higher total employment.

Now that we can compare the seasonally adjusted vacancy rates between the agricultural sector and the Canadian average, we see that the sector’s vacancy rate has been declining steadily over the past years, with some resistance through COVID-19, although agriculture tends to run above the national average. It remains important to monitor employment trends within the sector, particularly as the average age of farmers rises and concerns grow over replacing the aging farm operator population. All things considered, agriculture has a relatively low overall vacancy rate and a smaller employment payroll base, which raises questions about the sector’s capacity for continued employment growth — particularly given a fixed land base and a long-standing trend of substituting labour with larger equipment and automation. The elevated vacancy rate may have less to do with the sector stagnating than with broader economic conditions for the industry.
The RBC report also finds that Canada’s agricultural sector is struggling to attract young talent, citing low post-secondary enrolment rates. We will look at the data series pertaining to post-secondary enrolment in the country. The following graph selects the top four fields of study by enrolment for 2023/2024, plus agriculture, and presents the year-over-year enrolment rates historically.

Looking at total enrolment for the 2023/2024 academic year, agricultural programs rank second-lowest among all fields, while other disciplines — such as those shown in the graph above — dominate in enrolment volume. Year-over-year growth rates show a declining enrolment trend for agriculture, though the most recent data points to an encouraging uptick. A further lens worth applying relates to the labour force status by chosen major, which stems from the Canadian Census data. These values select the same fields of study, and filter for those who have a postsecondary certificate, diploma, or degree, across all ages and genders. Some limitations exist due to differing classification methodologies in the 2016 census, but the values are replicated as closely as possible.

As the above table shows, those with a major in Agriculture or a related field recorded the highest employment rates on average in both 2016 and 2021. Unemployment rates are less conclusive, though agriculture ranks second-lowest for that metric in 2021. It is also worth noting the scale of employment by field: in 2021, Agriculture and related majors accounted for 296,690 employed graduates, compared to 2,604,645 in Business and 1,639,260 in Healthcare. The smaller pool of graduates reflects a proportionally smaller program offering — when searching for college diploma and undergraduate university programs, agriculture returns 339 programs, compared to 5,796 for business, management, marketing, and related services; 1,513 for engineering and engineering technology; 112 for architecture and related services; and 403 for law, legal services, and legal studies.
Crisis Verdict: What's Next?
The data presented in this post complicate the prevailing narrative around Canadian agriculture. On productivity, Canada holds its own against major international competitors and ranks among the top domestic sectors by MFP growth — even as that growth has trended downward in recent years. On the talent side, agriculture graduates enjoy strong employment outcomes relative to many other fields, and the sector’s low vacancy count likely reflects structural realities of the industry rather than a failure to attract workers.
None of this is to say that the status quo is sufficient. The downward trajectory in productivity growth is real, and the long-term sustainability of the sector depends on reversing it. That reversal hinges in large part on investment — in research, in technology, and in the next generation of agricultural innovators. In Part 2 of this series, we will turn to that question directly: examining the state of public and private R&D funding in Canadian agriculture, the financial pressures facing producers, and what the data tell us about whether investment levels are keeping pace with the challenges ahead.


